
Tutorial
Getting Started
This guide shows how to use your data with EpiGe-App webserver. For this, we will use as an example the file EpiGe_sample_test.txt which is available for download in the Protocols and Materials tab.
- 1. Description of the data
- 2. Uploading Data
- 3. Retrieve results
- 4. Results
- 4.1. Basic information
- 4.2. Molecular classification of medulloblastoma
- 4.3. Cytosine methylation status predictor
- 4.4. Hamming distance-based similarity score
- 4.5. Quality control summary
- 4.6. Technical report
- 5. Download
1. Description of the data
This file was obtained directly from the Applied Biosystems QS5 thermocycler following the protocols available in the Protocols and Materials tab. This tab-separated values text file contains the data and metadata of the experiment in the form of different tables such as sample setup, raw data, results and others.
2. Uploading Data
The process of uploading the data is performed on the Upload data page which can be accessed from Run analysis in the navigation bar or through the RUN ANALYSIS button on the homepage.
Once there, the user encounters an input data form divided into two panels. The first panel is a list of conditions and requirements that the user must accept in order to upload a file to the server. Adherence to these conditions and requirements is essential to ensure the reliability of the results.
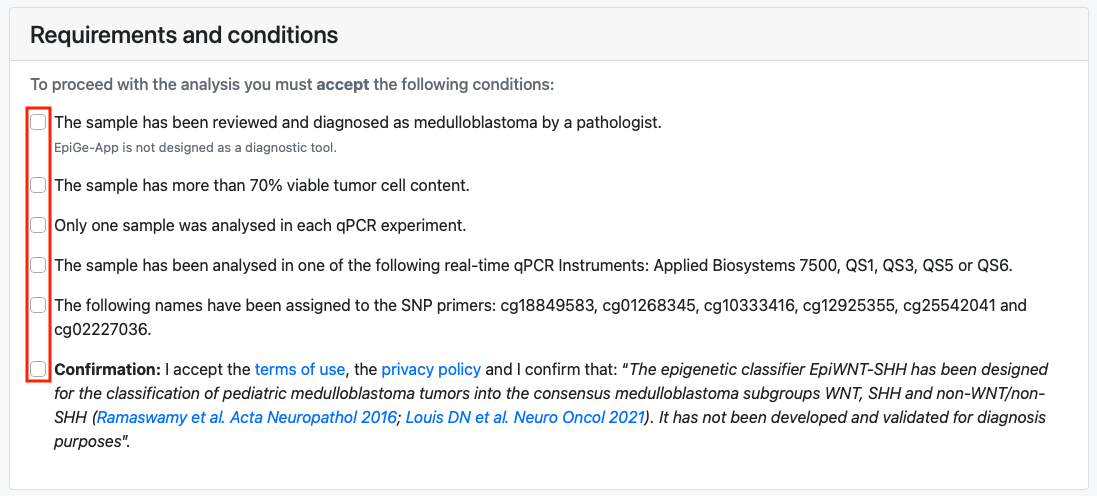
In the second panel, the user is required to assign an identifier to the analysis and select the text file they intend to upload. Optionally, they may choose whether to receive the results and information via e-mail and provide their e-mail address.
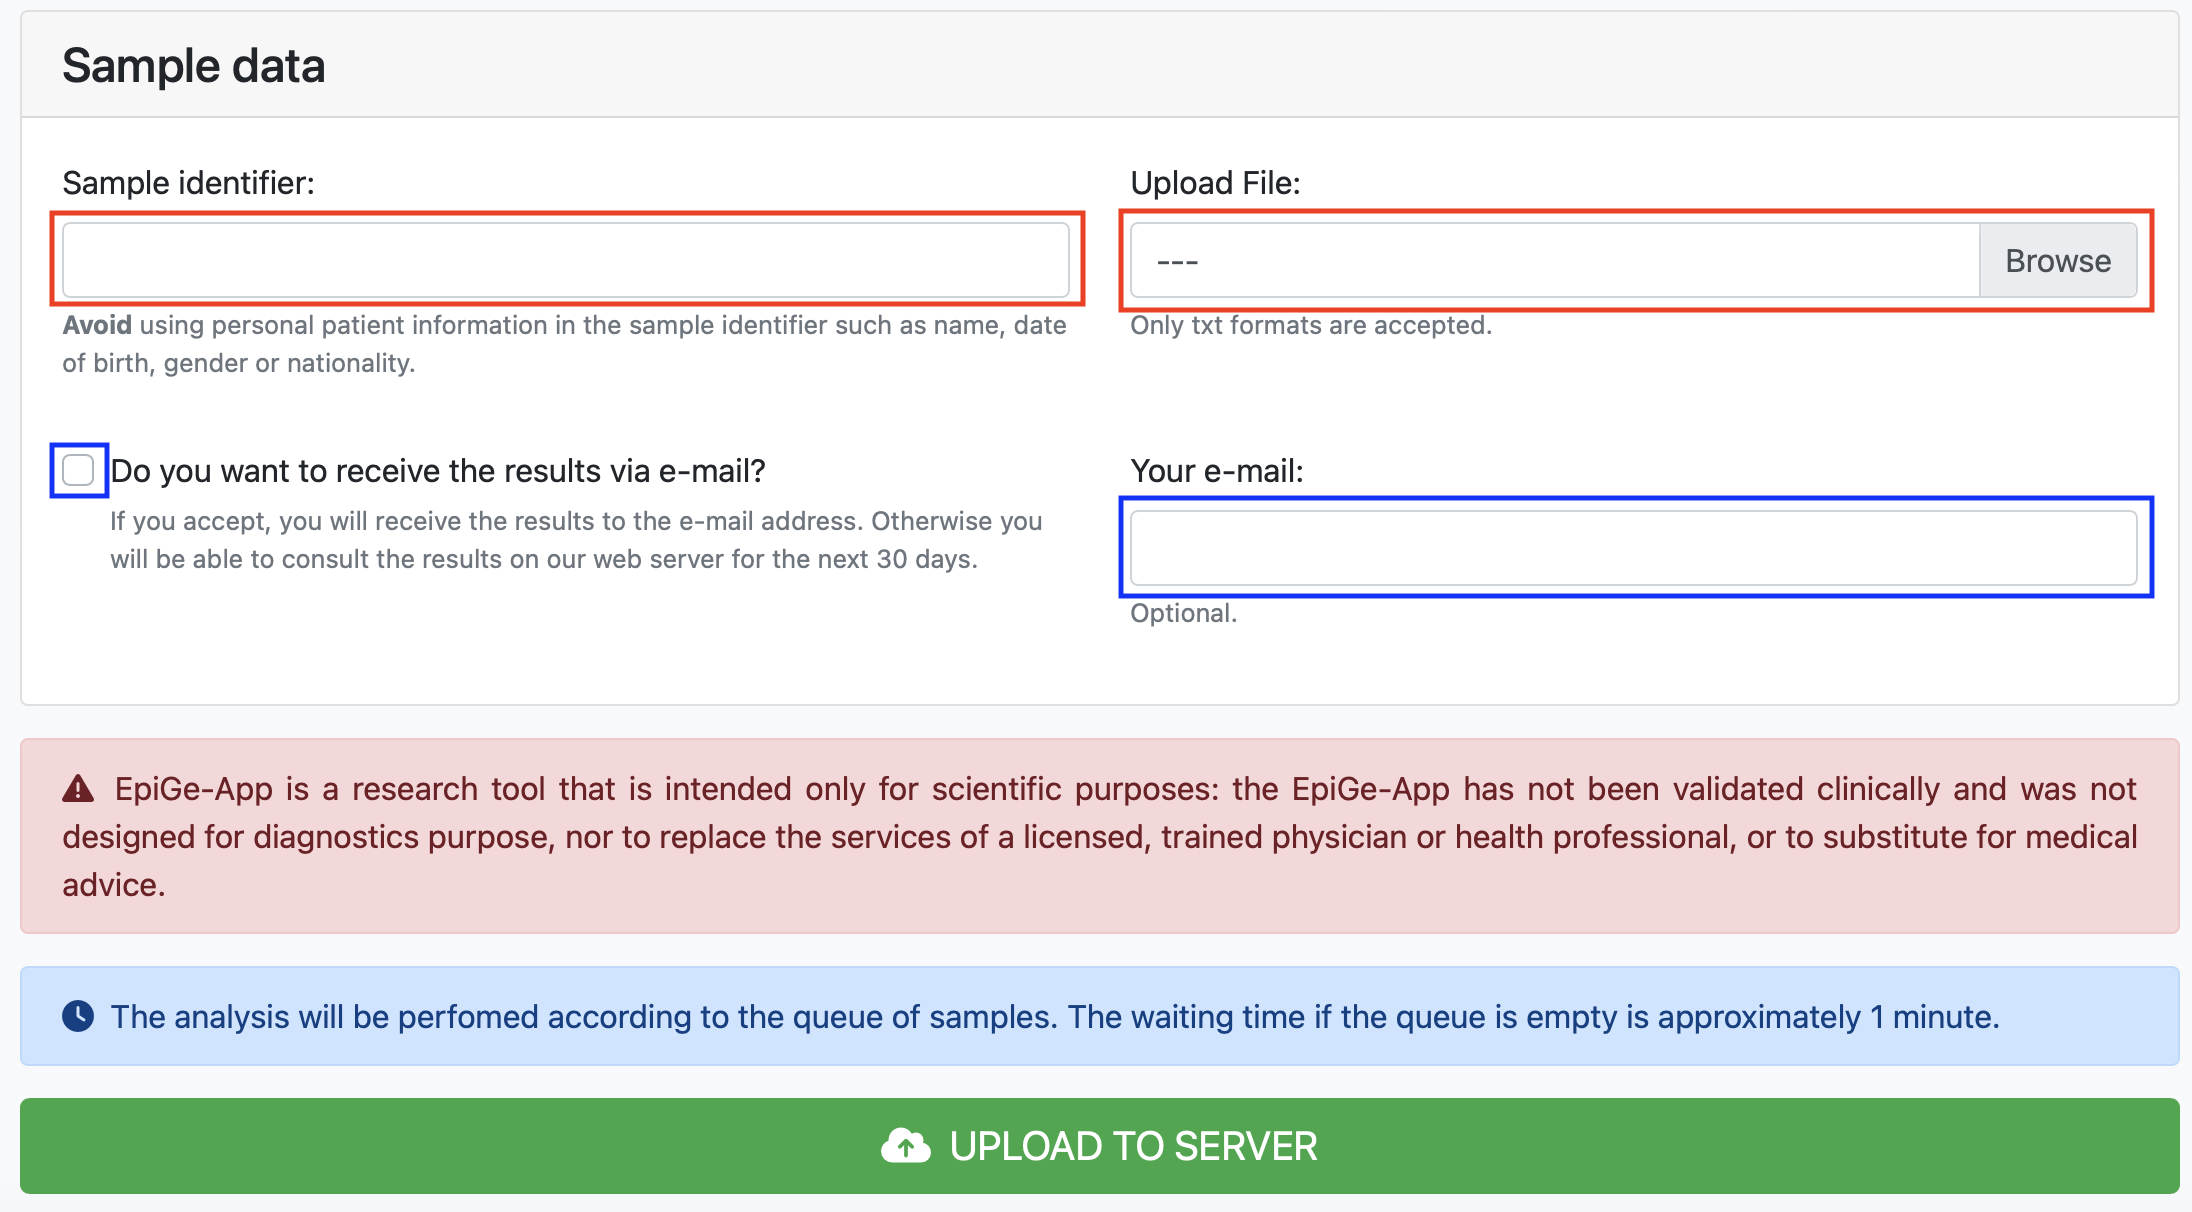
To complete the form successfully the user must accept and fill in the fields marked with red boxes. While the fields marked with blue boxes are optional. In this example, we have typed Sample test in the Sample ID text box and selected EpiGe_sample_test.txt file in the Upload File Browser.
Then, to upload the file simply click on the UPLOAD TO SERVER button.
Once the data has been successfully uploaded to EpiGe-App, a window will display your Job ID. You can automatically copy your Job ID to your clipboard by clicking the button in the red box. If you haven't provided an email, we recommend saving your Job ID properly to access the analysis results later.
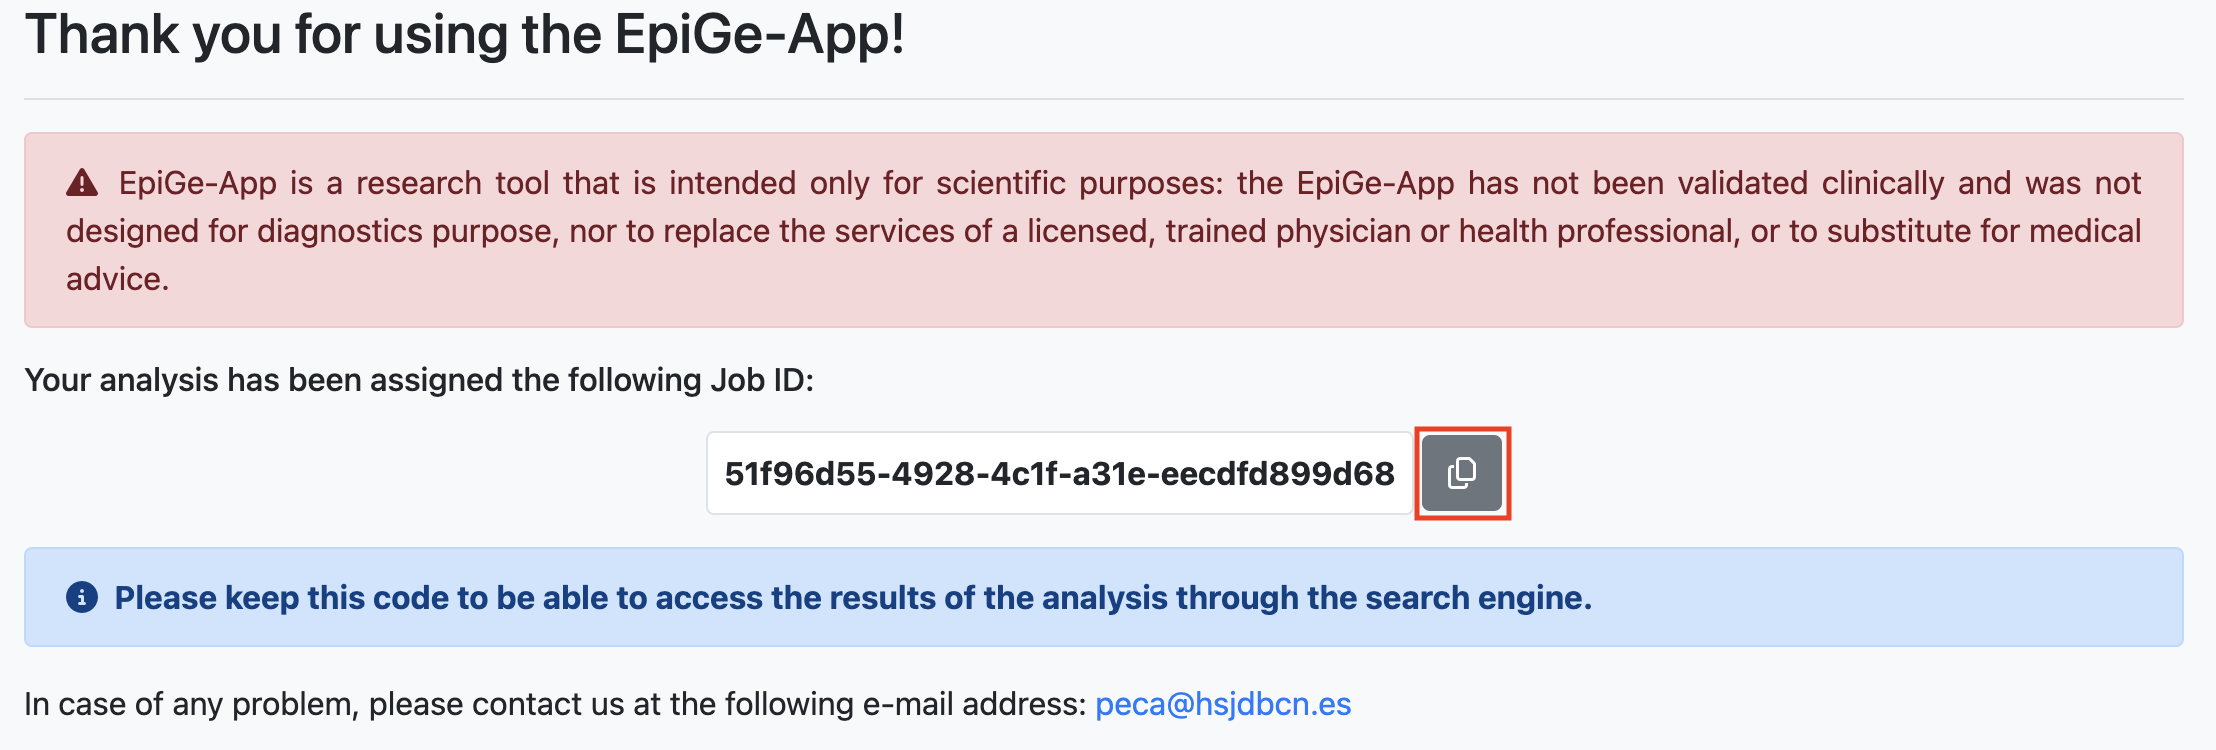
For instance, the Job ID for our submission is 51f96d55-4928-4c1f-a31e-eecdfd899d68.
3. Retrieve results
To check your results you can use the search engine in the top right corner. The results will be stored on our server for 30 days after we receive the data.

4. Results
In the next part of the guide we will discuss the results of an analysis. For this purpose, we will use the results obtained by the following Job ID: 51f96d55-4928-4c1f-a31e-eecdfd899d68.
4.1. Basic information
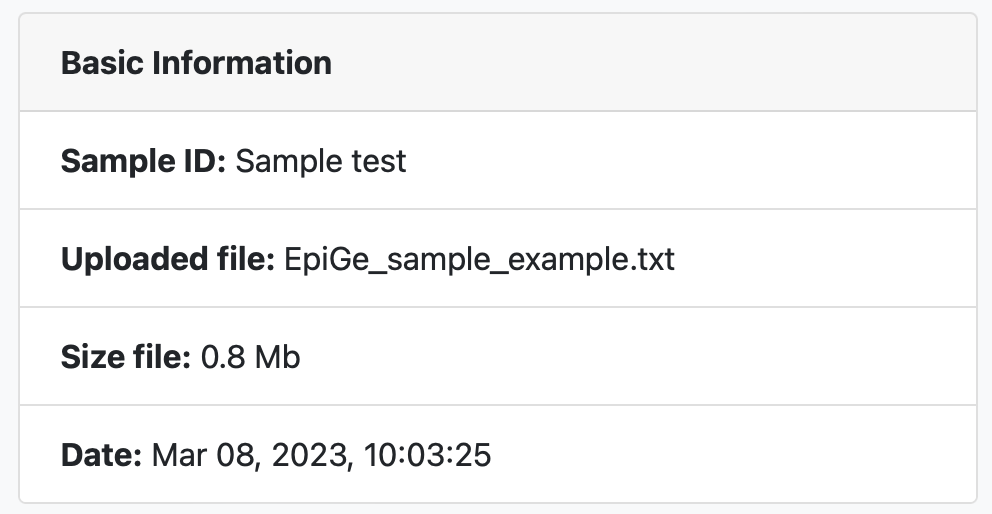
The first result we see when accessing a results page is a table with information about the uploaded text file such as the sample ID, the file name, the file size and the date the analysis was performed.
4.2. Molecular classification of medulloblastoma
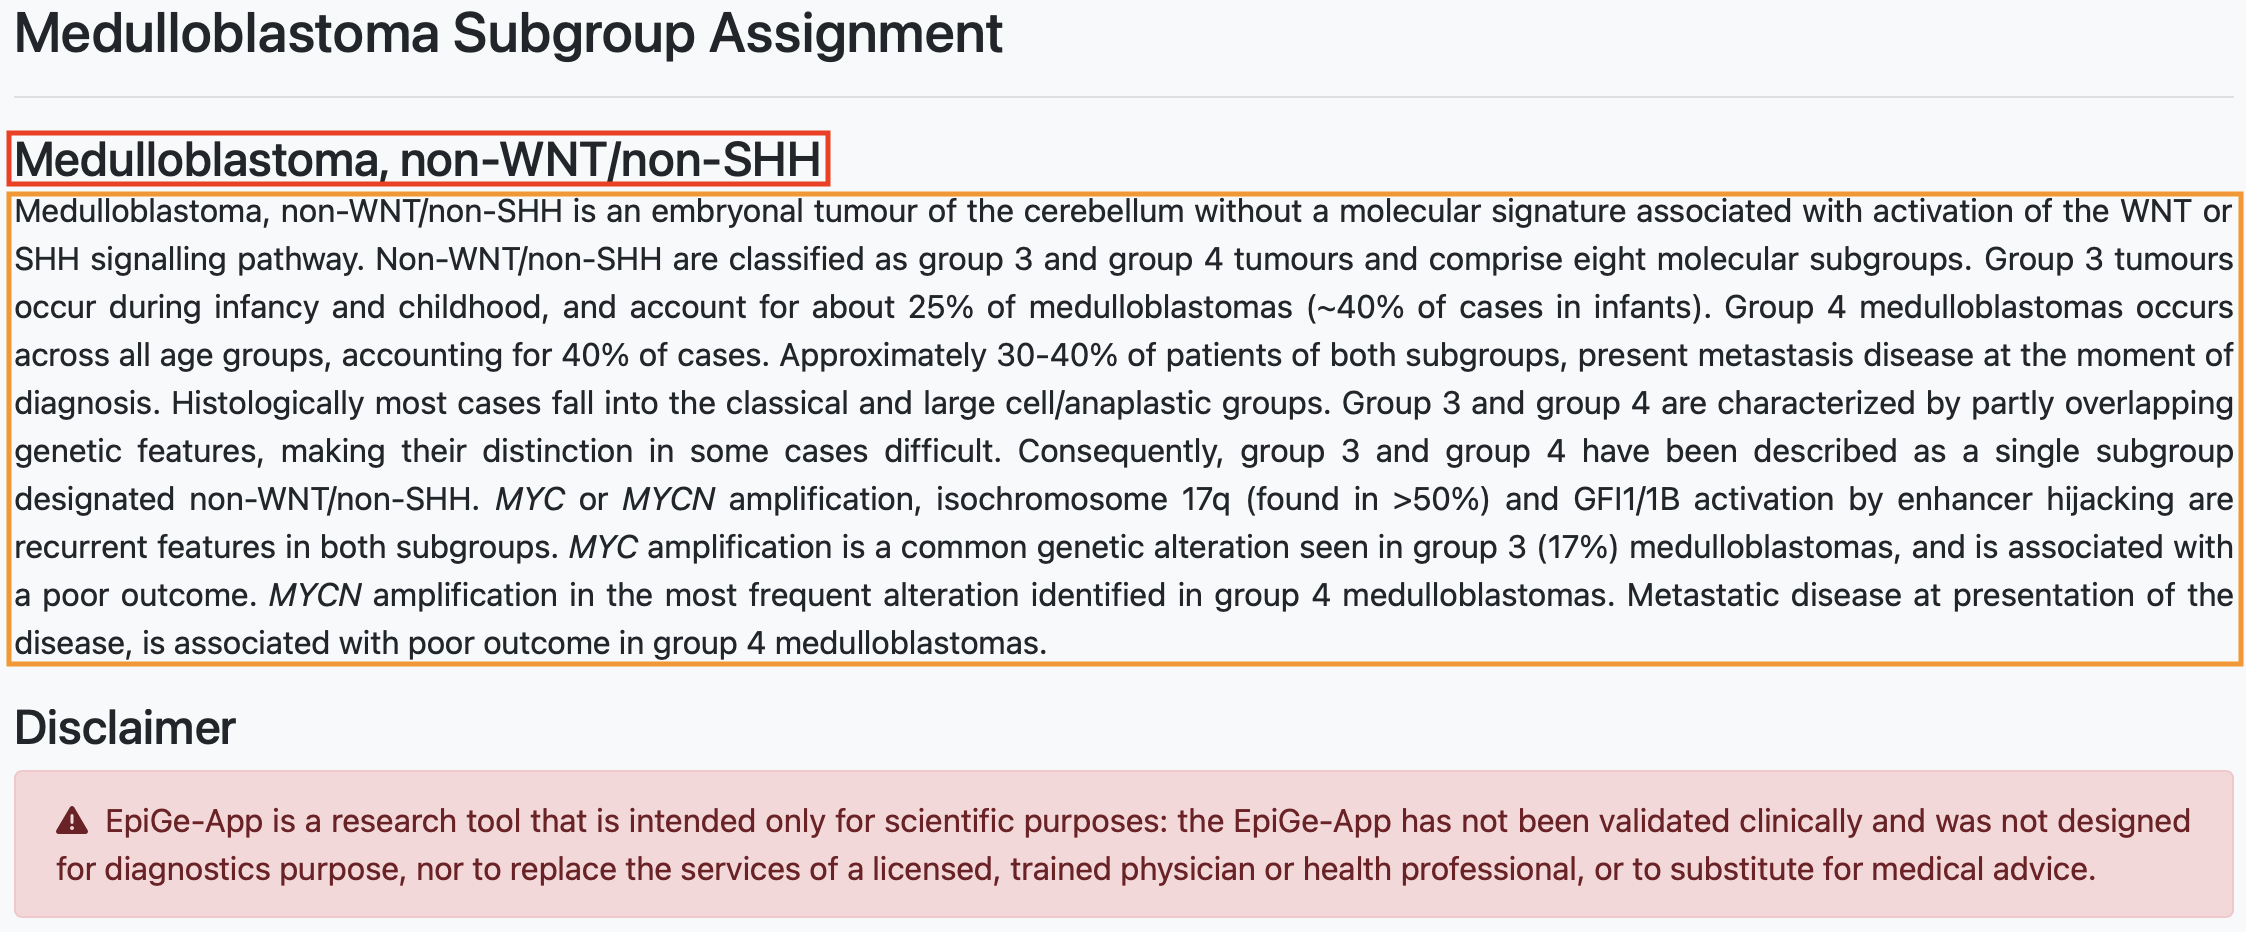
The next result presented to us is the molecular subgroup of medulloblastoma. In this section, we present the molecular subgroup derived from the sample analysis. Sections 4.3 and 4.4 show the results of both the methylation status predictor and the similarity score, providing the basis for this classification. In addition, we also add here extra information about the assigned molecular subgroup such as incidence, prognosis and genetic features. In the figure below you can see the assigned molecular subgroup in the red box and the description of this group in the orange box.
In this example, the identified molecular subgroup is non-WNT/non-SHH. Pertinent details about this subgroup indicate its composition, comprising two distinct subgroups (Group 3 and Group 4). However, these subgroups exhibit overlapping genetic characteristics, posing challenges in their differentiation.
Ultimately, a disclaimer is displayed to explicitly define its intended purpose. It explicitly states that while EpiGe-App serves as a research tool, it is not intended for diagnostic purposes.
4.3. Cytosine methylation status predictor
This section reveals the findings regarding the predicted methylation status of the cytosines that constitute the MB methylation signature.
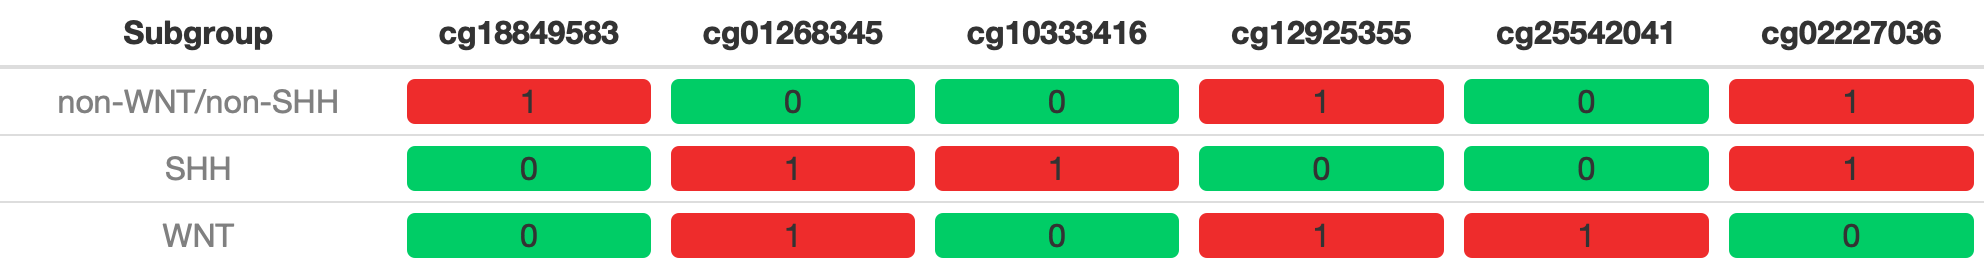
First, a table with the 3 different reference methylation signatures for each of the molecular subgroups is shown. These signatures have been obtained by binarising and coding in a specific order (cg18849583, cg01268345, cg10333416, cg12925355, cg25542041, and cg02227036) the 6 cytosines from previously published MB tumour DNA methylation data (n = 3,044). The methylation pattern of these signatures is very stable, repeating 97% for the non-WNT/non-SHH subgroup, 95% for the WNT subgroup and 89% for the SHH subgroup. For more detail iScience.
As can be seen in the figure below, the signatures differ in the methylation state of 4 cytosines between groups making it possible to distinguish between them.
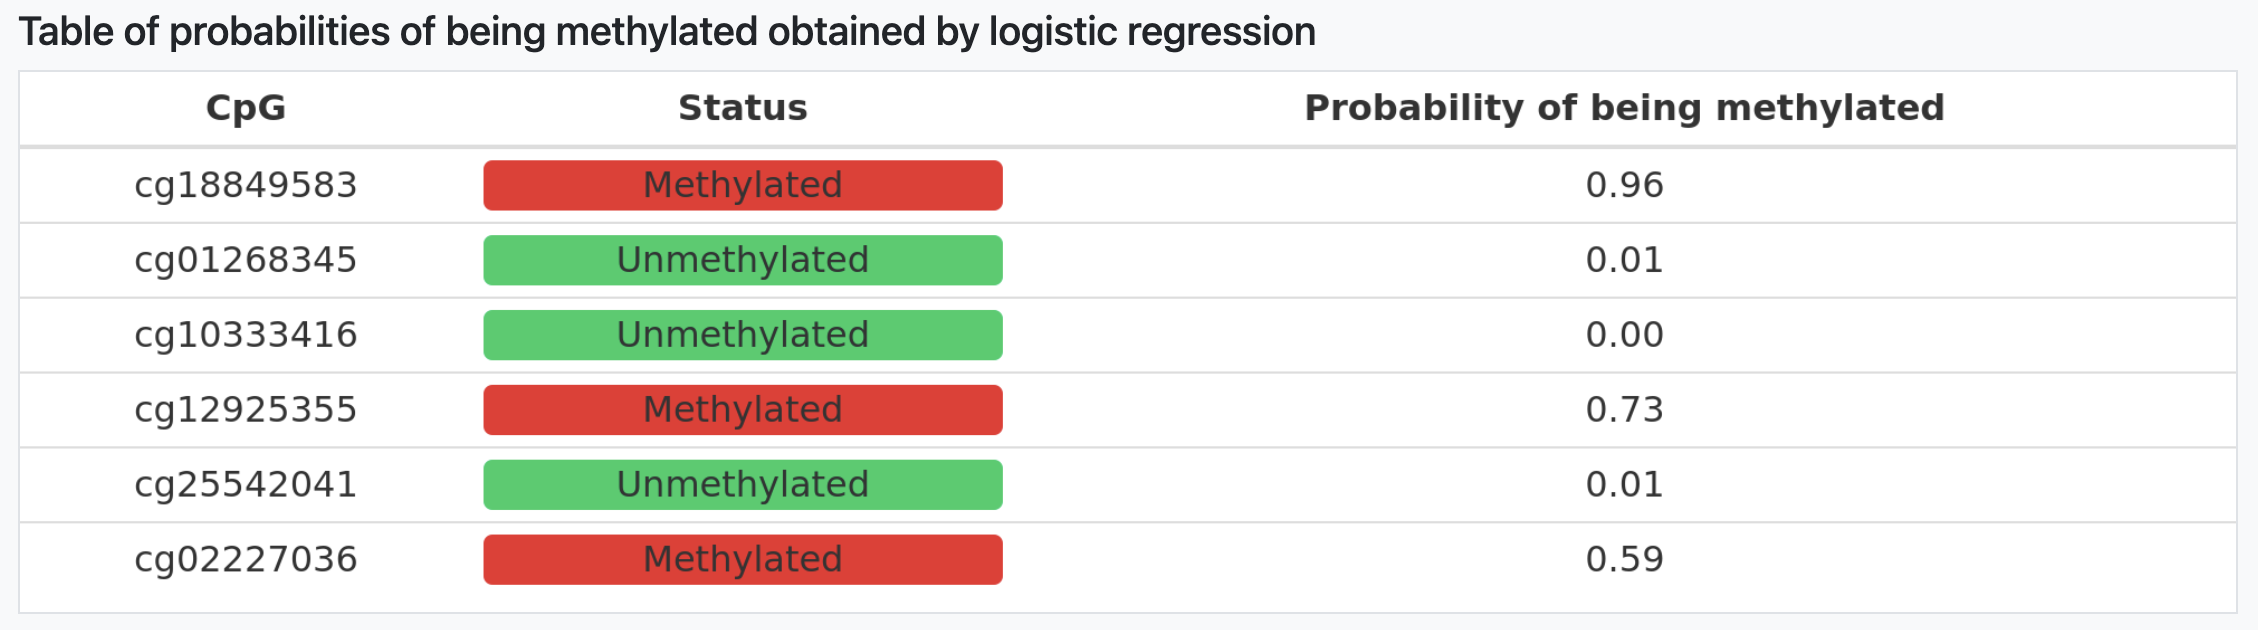
The following table shows the methylation status (methylated or unmethylated) assigned based on the probability of a cytosine being methylated.
This probability has been obtained through a logistic model trained with medulloblastoma data from patients at the Hospital Sant Joan de Déu. The AUC curve of this model is 0.98 (95% CI [0.96–0.99]), and the optimal cutoff value used is 0.456 based on the Youden index. Therefore, the sensitivity and specificity of the model are 94% (95% CI [87.5%–97.3%]) and 93.8% (95% CI [87.1%–97.2%]), respectively. For more detail iScience.
Thus, the methylation signature obtained for this sample is as follows:
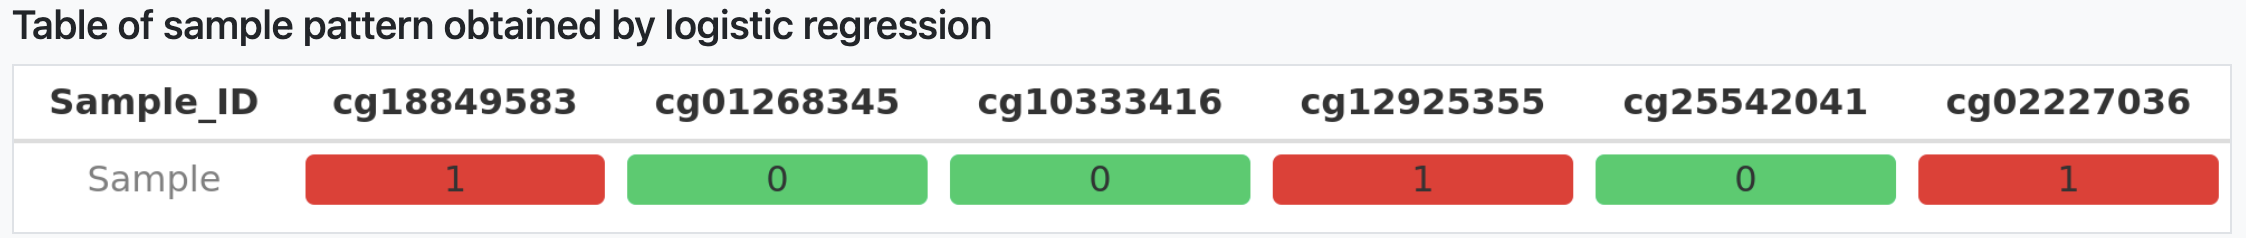
Now, we can use this methylation signature to calculate the Hamming distance between this and the three reference methylation signatures.
4.4. Hamming distance-based similarity score
This section presents the assigned molecular subgroup for a given sample. For this purpose, the Hamming distance (HD), the methylation signature of the sample, and the reference methylation signatures of the 3 subgroups are used. The HD indicates the number of different symbols between two strings of equal size. Hence, for 6-digit binary vectors, the HD can range from 0 to 6. A HD of 0 denotes identical character strings, while a measurement of 6 indicates complete dissimilarity between the strings. However, to enhance the interpretability of the HD, we have created a similarity score ranging from 0 to 1. This score can be interpreted as a perfect match if the score is 1, a high match if the score is = 0.83, and a low match if the score is 0.67.
In this example, the strings that we want to compare are the sample string (100101) and the strings of the subgroups (non-WNT/non-SHH, 100101; WNT, 011001; SHH, 010110).
Similarity score between the sample string and the strings of the subgroups:
- HD score for non-WNT/non-SHH (100101): 1.
- HD score for WNT (100101): 0.33.
- HD score for SHH (100101): 0.33.
Within the parentheses, you can observe the methylation string that forms the sample's signature. The digits highlighted in green have the same value as the methylation string of reference for that subgroup, while the digits highlighted in red do not have the same value.
These results are presented graphically in the radar plot and in a table format.
Radar plot of similarity scores:
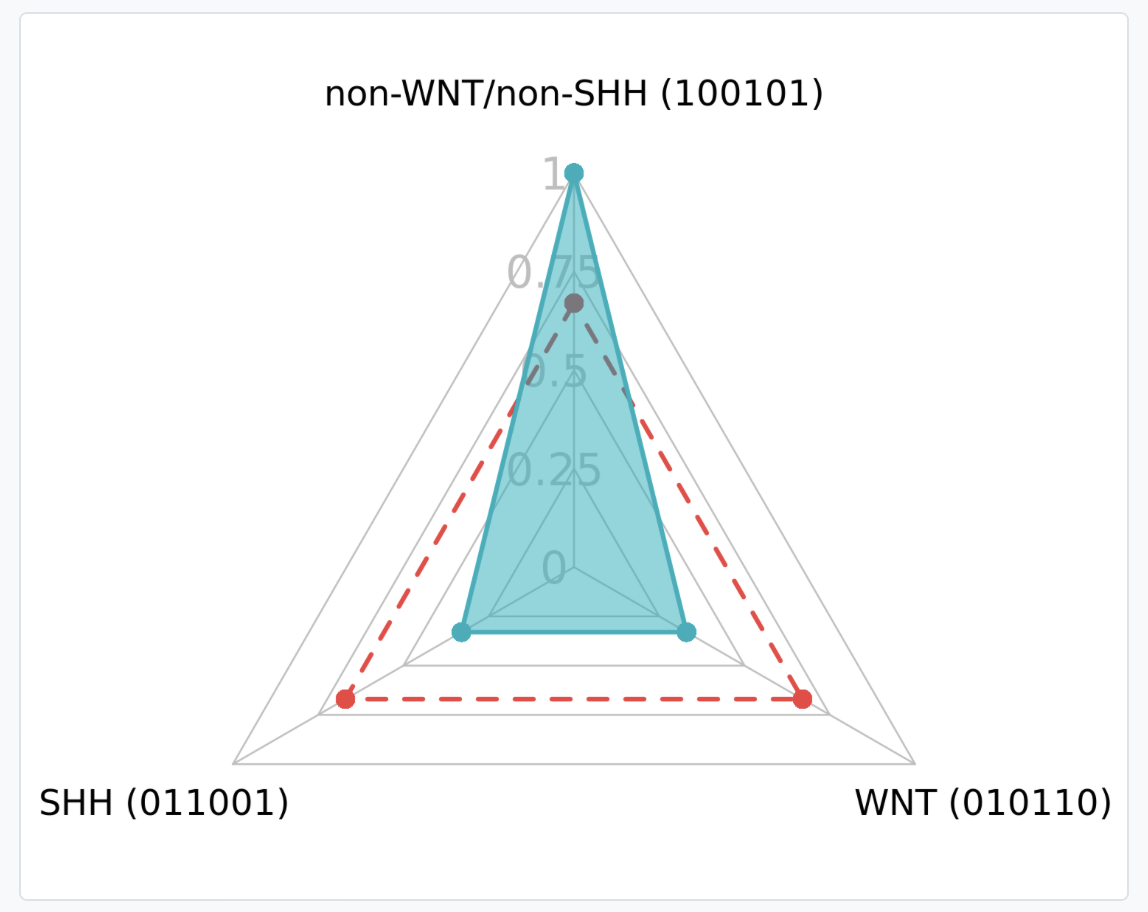
Table of scores:

The next part of the results is about the quality control (QC) of the data uploaded to the server.
4.5. Quality control summary
The first part of the QC results is a summary table of different incidents and suggestions on how to mitigate them.
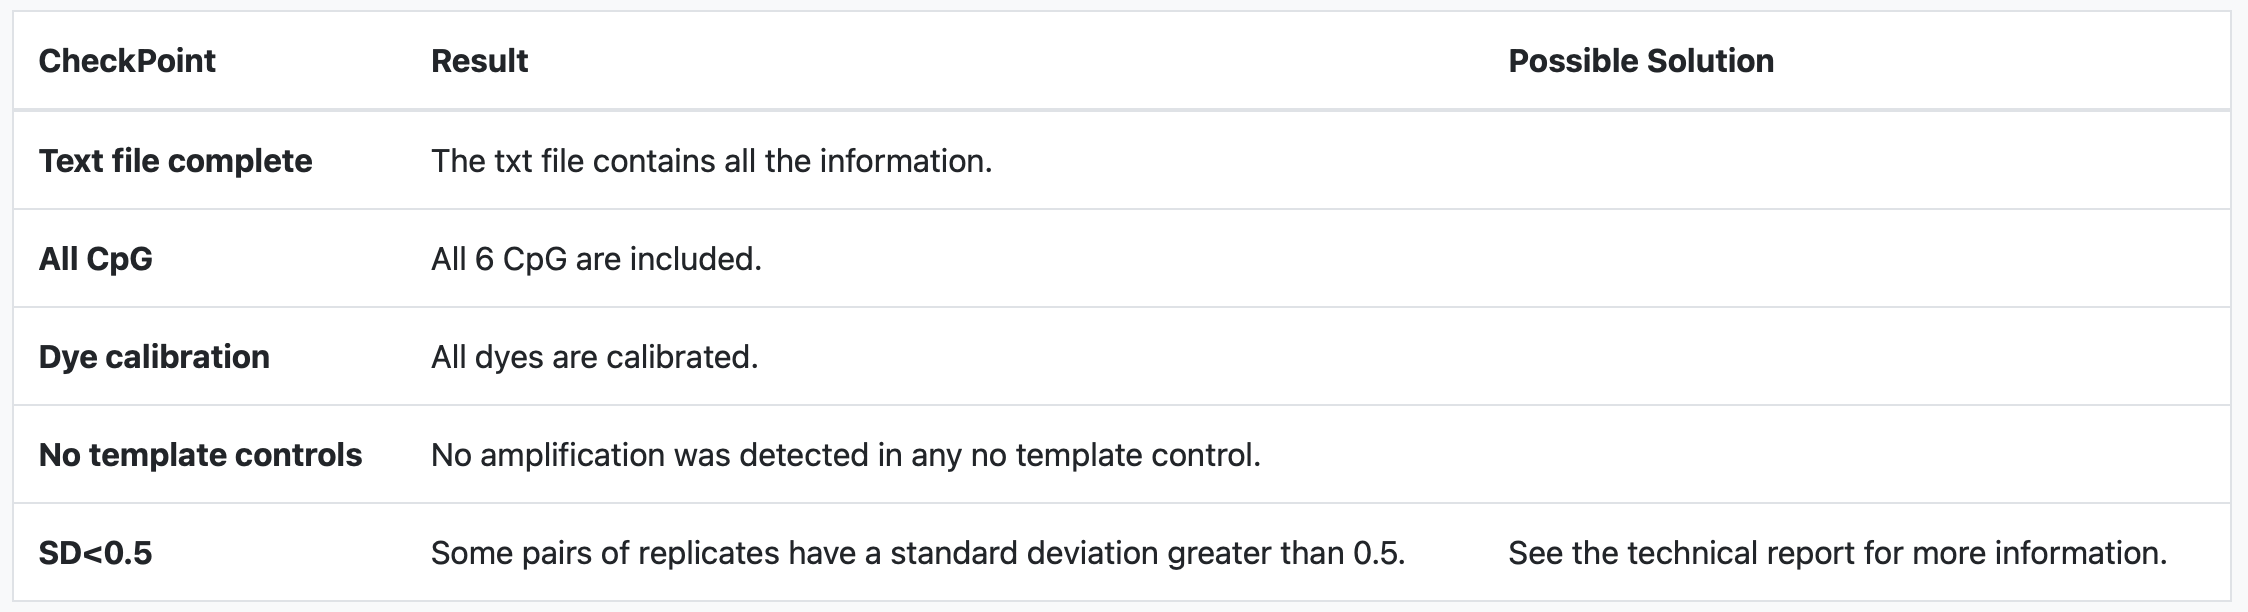
The possible incidences that we review in quality control that may influence the results are as follows:
- Text file complete: The system checks the text file to ensure it contains all the required data tables essential for conducting the analysis. If these tables are not present, the analysis will not proceed..
- All CpG: The system verifies whether the CpGs in the results data table are accurately labeled with the following names: cg18849583, cg01268345, cg10333416, cg12925355, cg25542041, and cg02227036. If any of these names are missing or incorrect, the analysis will not proceed.
- Dye calibration: The system verifies the experiment metadata to determine if the dye is calibrated and checks its calibration date. If the calibration has lapsed, it's possible that the results might not be reliable. We recommend conducting the experiment again using properly calibrated dye for accuracy. However, please note that the data analysis will proceed regardless of the calibration status.
- No template controls: The system examines the amplification of No Template Controls (NTCs). If any amplification is detected, it raises doubts about the accuracy of the data amplification process. Consequently, we cannot assure the correctness of the results obtained through the analysis. It is highly advisable to conduct the experiment again if such amplification occurs, ensuring more reliable outcomes.
- SD<0.5: The system checks for consistent amplification among replicates. If there is notable variation among replicates, it suggests potential amplification errors in certain wells. Such variability could undermine the reliability of the experimental data. We consider deviations below 0.5 as standard and acceptable in our experiments. Deviations beyond this threshold might indicate potential issues.
In this example our data passes all QC checkpoints except the standard deviations between replicates checkpoint. So we are instructed to review the technical report to see what happened.
4.6. Technical report
The next part of the results goes more in depth into the incidences of the QC summary table.
Calibration information

In the table above we can see how the different dyes are calibrated and when the last calibration was performed.
Non template control amplication
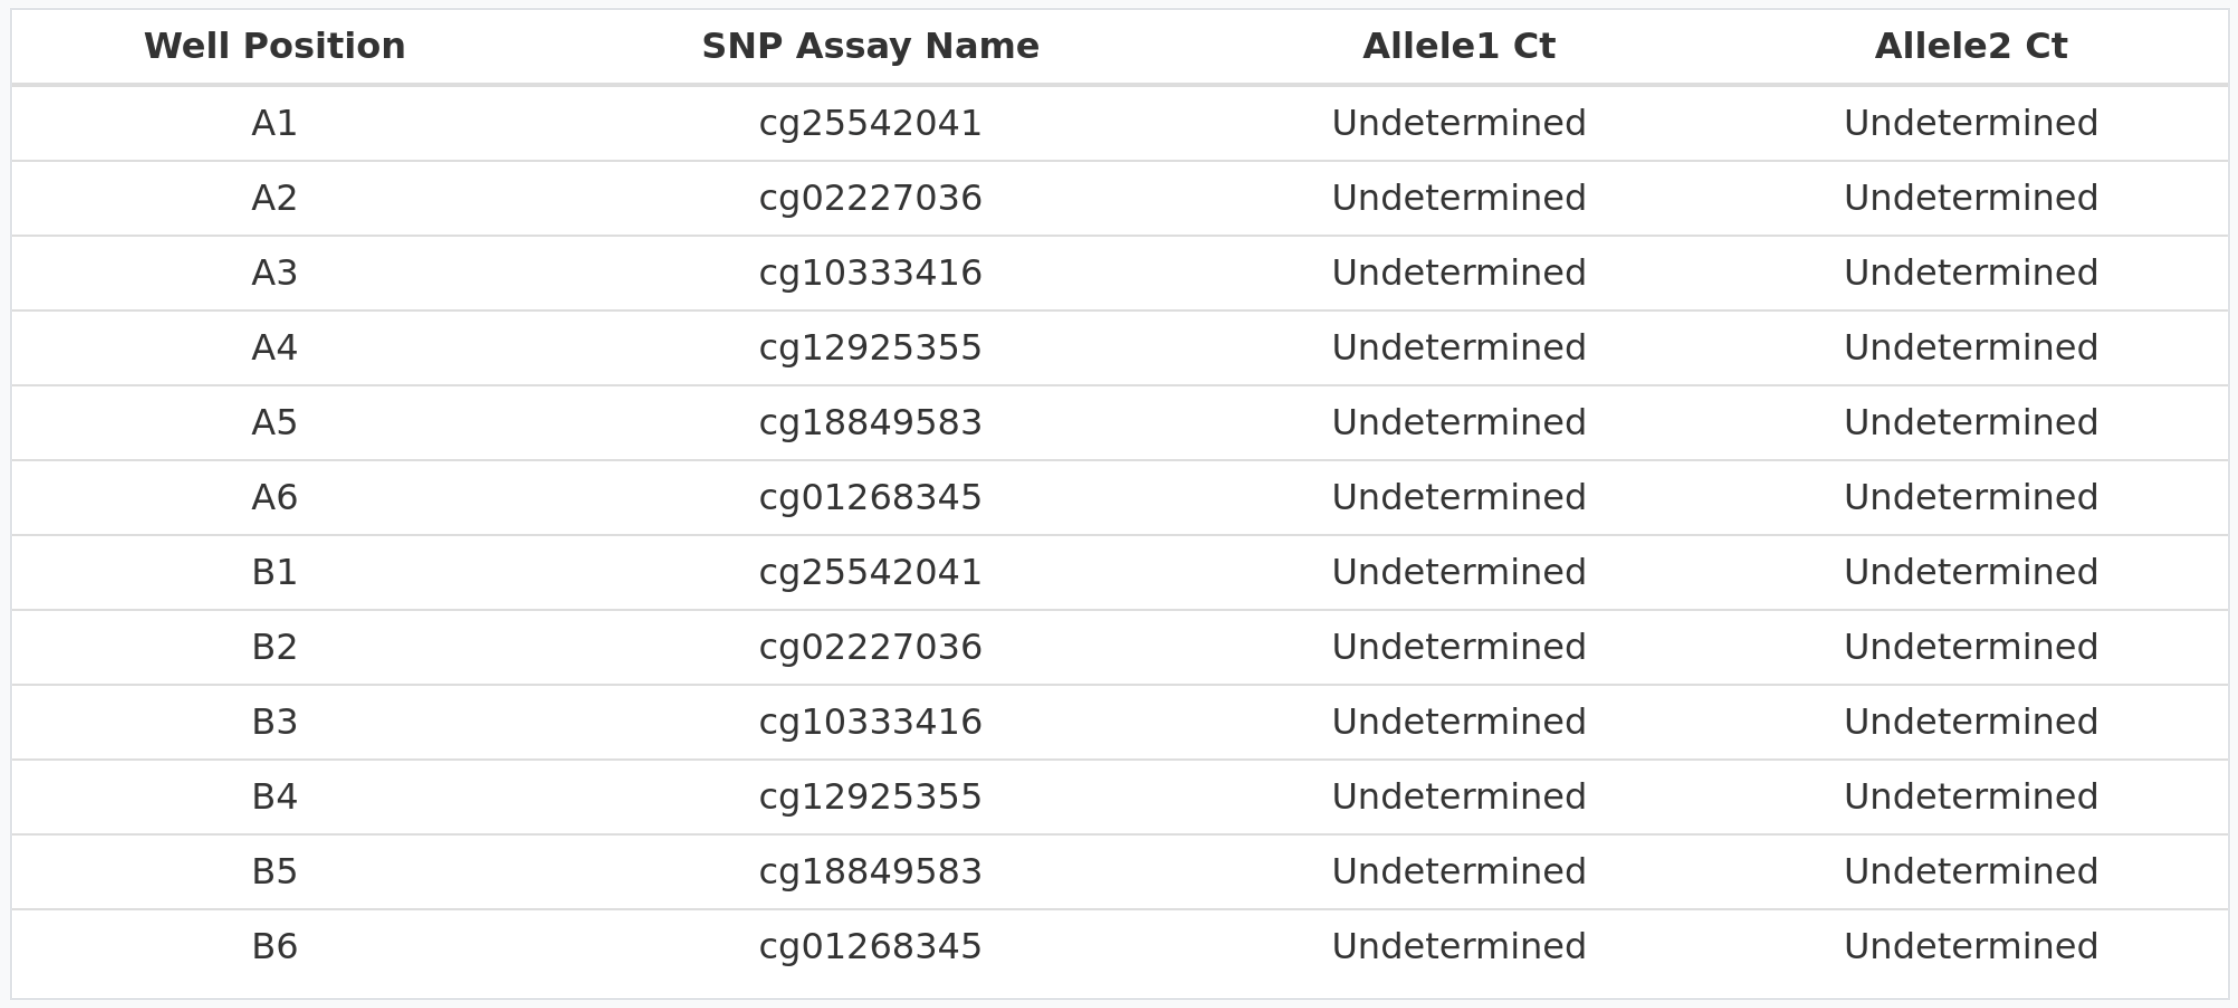
In the table above we can see how no amplification (Undetermined value) is detected for the different NTCs for each of the cytosines.
Standard deviations > 0.5
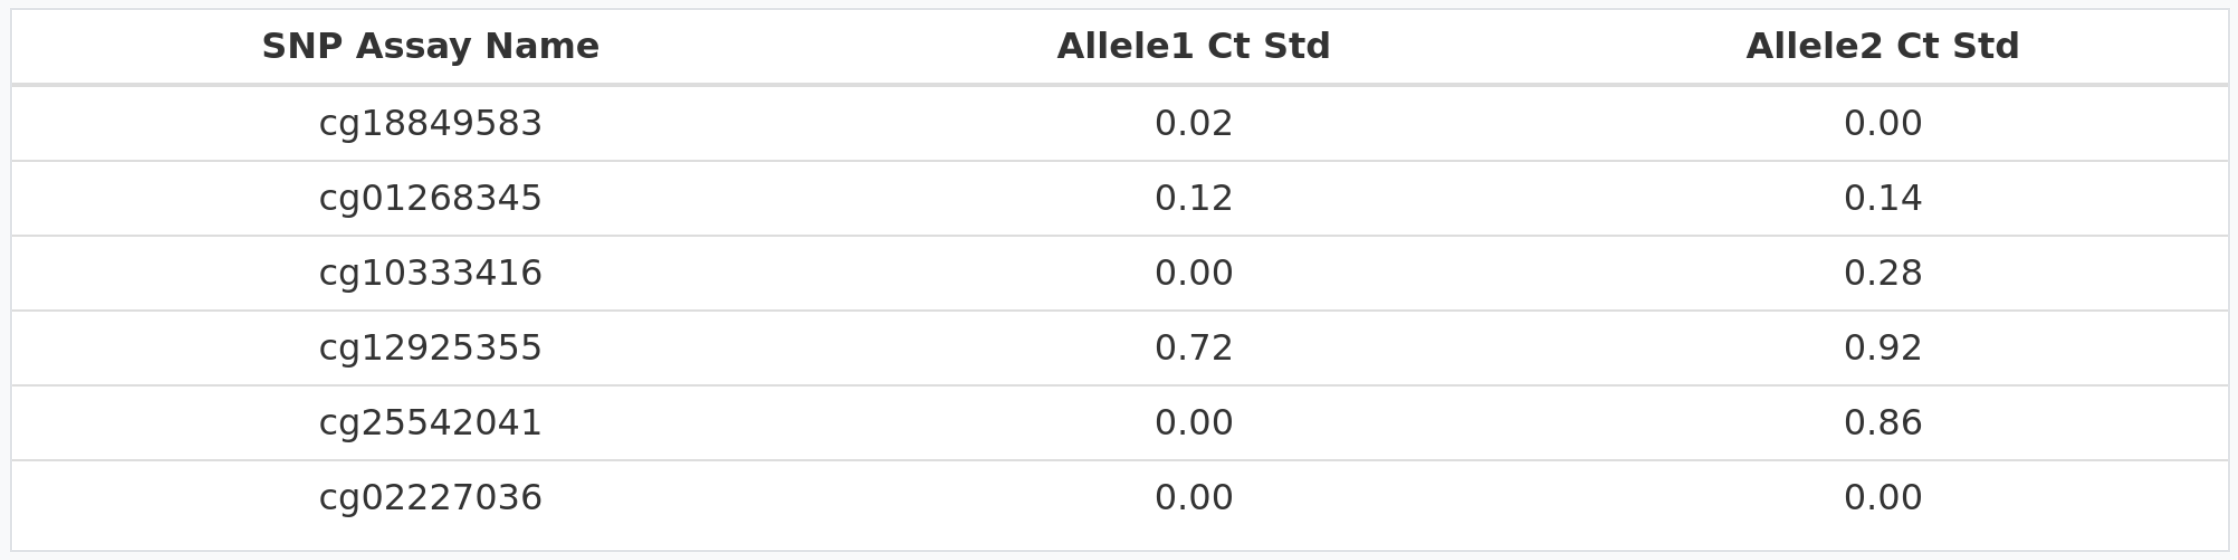
In the table above we can see the standard deviation for allele 1 (methylated allele) and allele 2 (unmethylated allele) for each cytosine. In this case, there are 2 cytosines (cg12925355 and cg25542041) where at least one allele is higher than 0.5. Therefore, we advise users to redo the qPCR experiment.
5. Download
Ultimately, users can obtain their analysis results by clicking the "Download as PDF file" button. This feature ensures access to data beyond the 30-day storage period maintained by the web server.